I’d bet most R developers have - or will have - faced the issue of having to optimise a big piece of code. Some processes might take way too much time, or they are filling memory space until the session explodes and everything crashes.
One of the most infamous caveats of programming with R is how slow it
can be to loop through columns of a data.frame. It has been widely
discussed and everyone knows that you shouldn’t use a for loop to
iterate a function over many columns, you should use the apply()
family for that. But we also know that sometimes you just can’t avoid
using classic loops, for example when your calculation depends on
previous iterations.
So here I want to introduce you to a very simple way to dynamically
create columns blazingly fast in a loop. We are going to make use of
data.table, as it’s usual when we want to optimise R code, and its
fantastic modification by
reference.

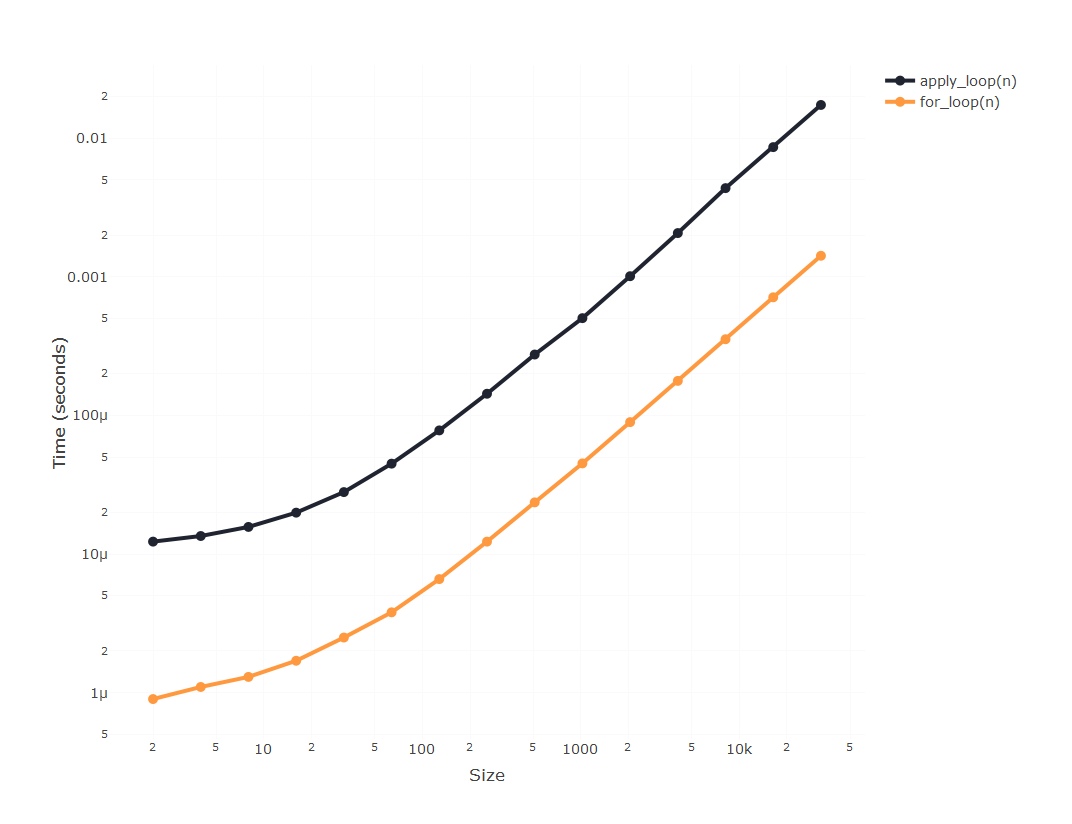
Firstly, whw do we make R loops faster? Well, a widespread misconception
about R programming is that loops are inherently slow. The actual loop
is actually as fast as you can expect from a high-level language; and
it’s easy to test that looping through something light as a vector is
actually as fast as what you can achieve with the apply() family:
library(bench)
library(plotly)
library(dplyr)

# Function to quickly visualise the results of the performance analysis. We'll be using this function across this article
plot_results <- function(results) {
  results %>%
    select(expression, median, n) %>%
    mutate(expression = as.character(expression)) %>%
    plot_ly(colors = c("#1f2430", "#4CCFE6", "#FFCC66", "#F07171", "#FF9940")) %>%
    add_trace(x = ~n, y = ~median, color = ~expression, type = "scatter", mode = "lines+markers") %>%
    layout(
      xaxis = list(type = "log", title = "Size", gridcolor = "#fafafa"),
      yaxis = list(type = "log", title = "Time (seconds)", gridcolor = "#fafafa"),
      font = list(size = 13)
    )
}

# Iterating over a vector using a vanilla 'for' loop
for_loop <- function(n) {
  v <- c(1:n)
  for (i in 1:n) v[i] <- i * i
  return(v)
}

# Same iteration using the 'apply' function
apply_loop <- function(n) {
  v <- c(1:n)
  v <- sapply(v, function(i) i * i)
  return(v)
}

# Meaure performance of both approaches
results <- bench::press(
  n = 2^(1:15),
  {
    bench::mark(
      for_loop(n),
      apply_loop(n)
    )
  }
)

# See results
plot_results(results)
So if the loop is not slow, why looping through columns is so
infuriatingly slow? Because of the way we access those columns. Every
time you accessing the column of a data.frame by df[, j] you are
accessing the whole of your data.frame and only later selecting just
that column. And that’s an efficiency issue that’s going to grow
non-linearly with the size of your data.frame.
The magic of using data.table is that you will be able to only access
the actual piece of memory that contains only what you are looking for.
And we do that using the set() function. To ilustrate how to use it, we are going to do a simple operation of columns, simply create a
column_3 that will be the result of multiplying column_1 and
column_2:
library(data.table)

# Create dummy data.table
dt <-
  data.table(
    column_1 = sample(100:1000, size = 500, replace = TRUE),
    column_2 = sample(1:10, size = 500, replace = TRUE)
  )

# Convert to data.frame
df <- as.data.frame(dt)

# Base R way
df$column_3 <- df$column_2 * df$column_1

# dplyr way
df <- df %>% mutate(column_3 = column_2 * column_1)

# vanilla data.table way
dt[, column_3 := column_2 * column_1]

# extra efficient data.table way
set(dt, j = "column_3", value = dt$column_2 * dt$column_1)
You specify the column name you’re referring to by their name in a
string, using the j parameter. And then you input the desired value in
the value parameter. Note that the set() function can be more
verbose and definitely less clear, but bear with me because what you lose in readibility you
gain it on efficiency.
Now let’s imagine that you need to iterate that process. That would mean you want to create a j column that is the result of multiplying the columns j-1 and j-2, where j can be a very big number.
# Create dummy data.table
dt <-
  data.table(
    column_1 = sample(100:1000, size = 500, replace = TRUE),
    column_2 = sample(1:10, size = 500, replace = TRUE)
  )

# Convert to data.frame
df <- as.data.frame(dt)

# Create new columns using simple base R technique
base_r_way <- function(df, n) {
  for (j in 3:n) {
    new_column <- paste0("column_", j)
    old_column_1 <- paste0("column_", j - 1)
    old_column_2 <- paste0("column_", j - 2)
    df[[new_column]] <- df[[old_column_1]] * df[[old_column_2]]
  }

  return(df)
}

# Create new columns using the usual 'dplyr' approach
dplyr_way <- function(df, n) {
  for (j in 3:n) {
    new_column <- paste0("column_", j)
    old_column_1 <- paste0("column_", j - 1)
    old_column_2 <- paste0("column_", j - 2)
    df <- df %>% mutate(!!new_column := UQ(rlang::sym(old_column_1)) * UQ(rlang::sym(old_column_2)))
  }
  return(df)
}

# Create new columns by reference using `set()` and data.table
efficient_way <- function(dt, n) {
  dat <- data.table::copy(dt)
  for (j in 3:n) {
    new_column <- paste0("column_", j)
    old_column_1 <- paste0("column_", j - 1)
    old_column_2 <- paste0("column_", j - 2)
    set(dat, j = new_column, value = dat[[old_column_1]] * dat[[old_column_2]])
  }
  return(as.data.frame(dat))
}

# Evaluate performance
results <- bench::press(
  n = 2^(2:6),
  {
    bench::mark(
      base_r_way(df, n),
      dplyr_way(df, n),
      efficient_way(dt, n)
    )
  }
)

plot_results(results)
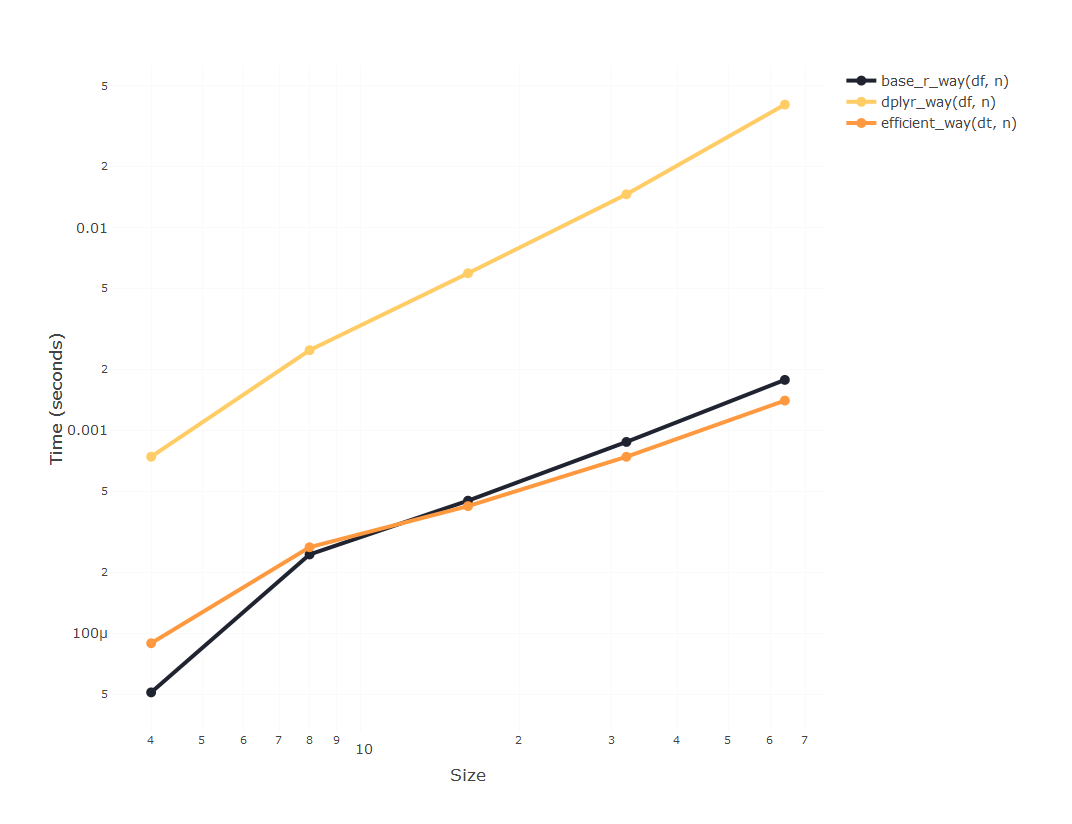
It seems that using data.table is going to be substantially faster
than using dplyr, but since apparently the time required to compute
using dplyr is blowing up, we’ll only incrase the size of the
experiment using the other two, so we can compare them:
# This chunk will throw an error, because `efficient_way()` is referencing more columns than they exist
results <- bench::press(
  n = 2 ^ (2 : 15),
  {
    bench::mark(
      base_r_way(df, n),
      efficient_way(dt, n)
    )
  }
)
But here’s the catch: If you run this piece of code, you’ll encounter
this
Internal error: DT passed to assign has not been allocated enough column slots.
Which basically means that a data.table object has a predefined
expected number of columns that can’t be expanded using set(), and
will throw an error once we get above that number, which is 1024. How do
we solve that? It’s actually as easy as assigning those extra columns
beforehand:
efficient_way <- function(dt, n) {
  dat <- data.table::copy(dt)
  # If we know we are going to reference a large number of columns, we should allocate memory for them
  if(n > 1024) alloc.col(dat, 2^16)
    for (j in 3:n) {
      new_column <- paste0("column_", j)
      old_column_1 <- paste0("column_", j - 1)
      old_column_2 <- paste0("column_", j - 2)
      set(dat, j = new_column, value = dat[[old_column_1]] * dat[[old_column_2]])
    }
  return(as.data.frame(dat))
}
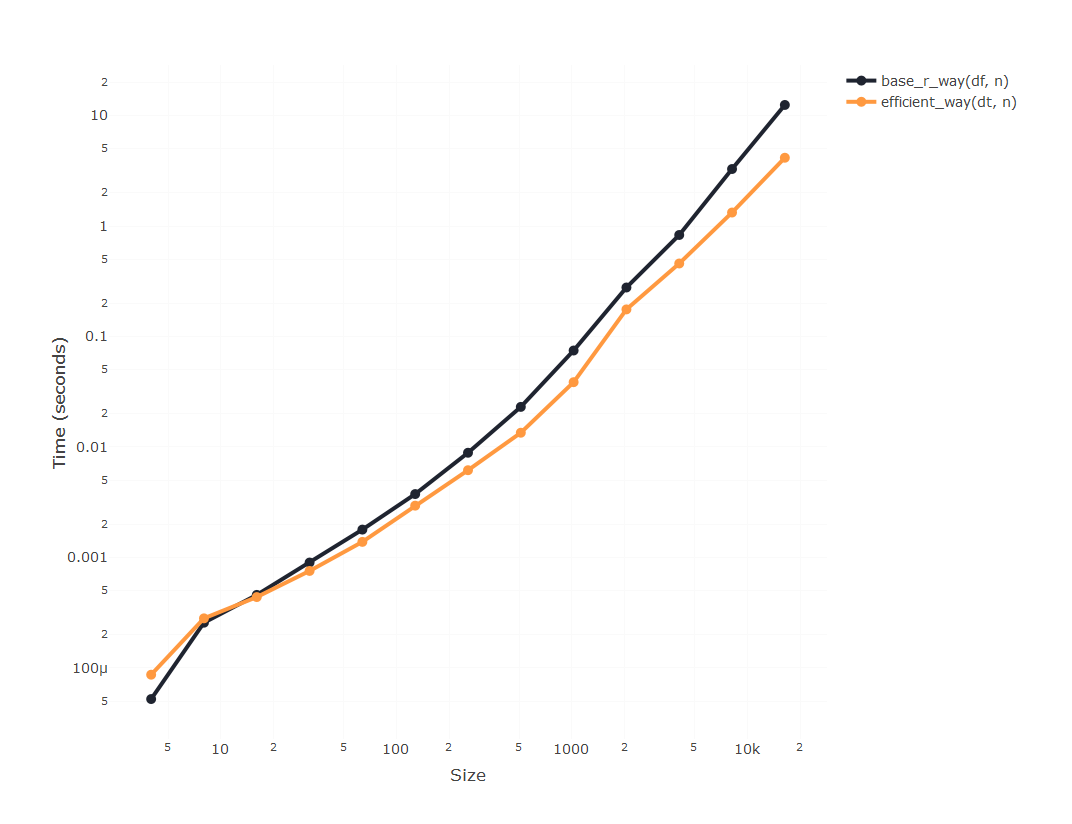
And now we can run the experiment with a very big number of columns and
check that, indeed, using the set() function in a data.table makes
looping through columns blazingly fast.
results <- bench::press(
  n = 2 ^ (2 : 14),
  {
    bench::mark(
      base_r_way(df, n),
      efficient_way(dt, n)
    )
  }
)

plot_results(results)